Default: simplicity with TILES
In de default setting, the Group Virtual Consultant has two options for navigation: the menu drop-down on the left of the screen (1.) and the tiles that occupy the central part of the screen (2.):
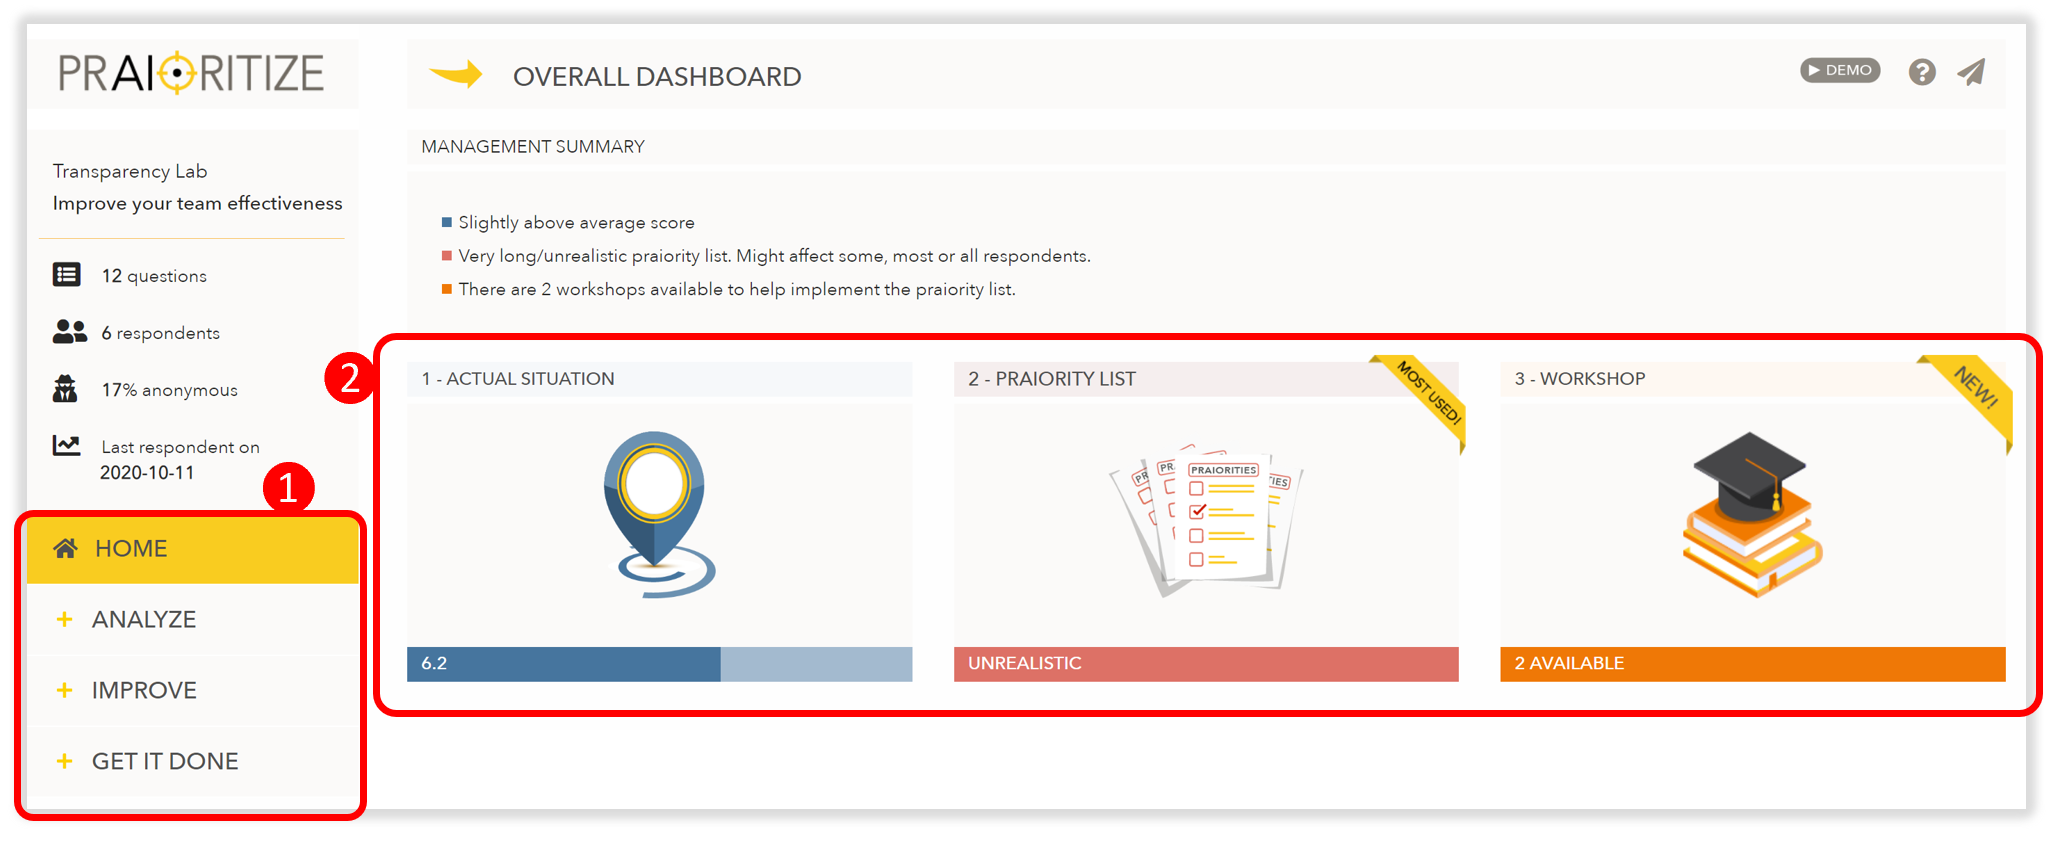
The tiles are reserved for the most critical reports and are there for simplicity reasons: click on the tiles, and you know all you need to know.
Alternative: numbers with STATS
The STATS view can be shown simultaneously with - or separate from - the TILE VIEW. The Virtual Consultant looks like this:
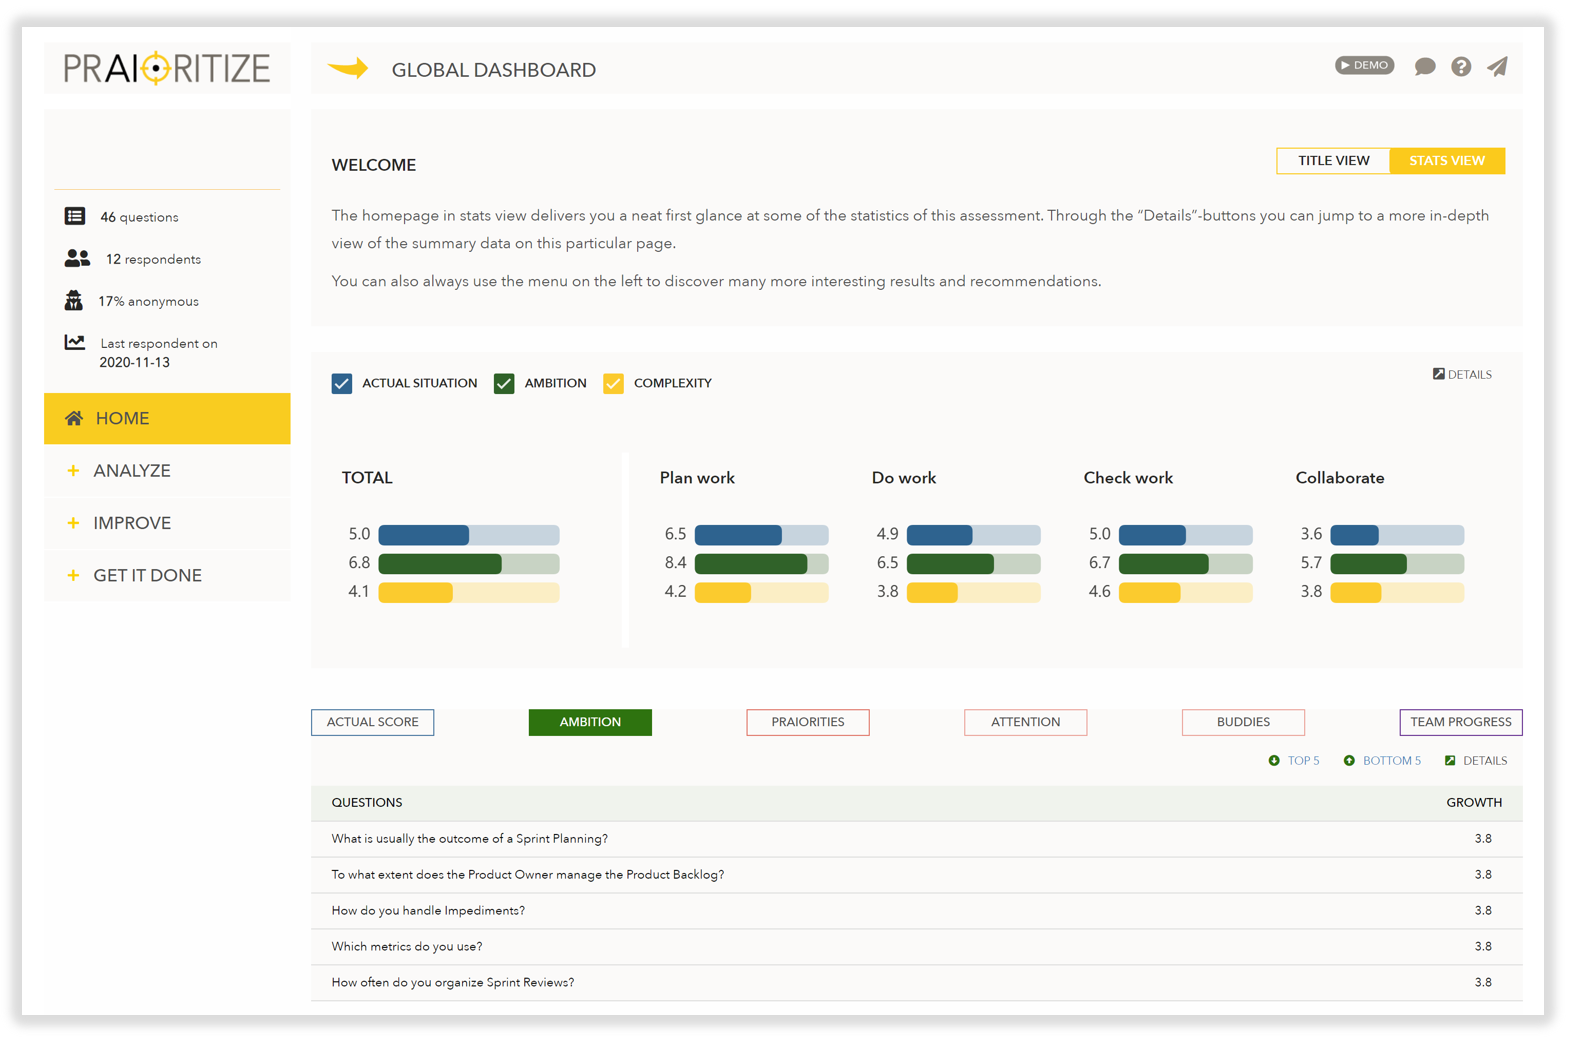
It shows the scores for selected parts of the Questionnaire (Actual score and Ambition) and allows you to compare them with, e.g., a satisfaction- or complexity score. (This requires some thinking when constructing the Questionnaire itself). Besides the total scores for the entire Questionnaire, it is possible to select eight other bar charts. These can be Topics or Sub-Topics.
Below these bar charts are summary tables for Actual Scores, Ambition, and other views. These tables summarize the full tables that can be found using the navigation. These summary tables on the STATS homepage show the bottom- and top-5 scoring items; the Details button brings the user directly to the full table:
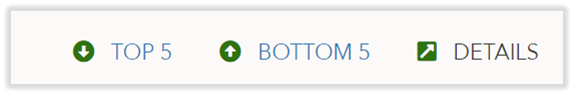
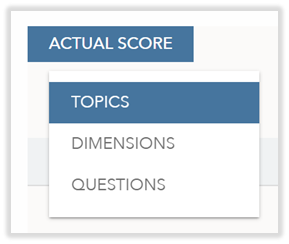
Some tables allow for a bit more detailing. For example, the table about the actual situation quickly shows the top/bottom-5 scoring topics, dimensions, and questions:
The advantage of the summary tables is having a quick overview of the most critical reports, check-out the top/bottom-5 scoring items, and the 1-click option to see the full table.
Personalizing the STATS homepage
Go to MY ASSESSMENTS, click on "EDIT THIS ASSESSMENT," and then on "CUSTOMIZE." Then, move halfway through the page to this section:
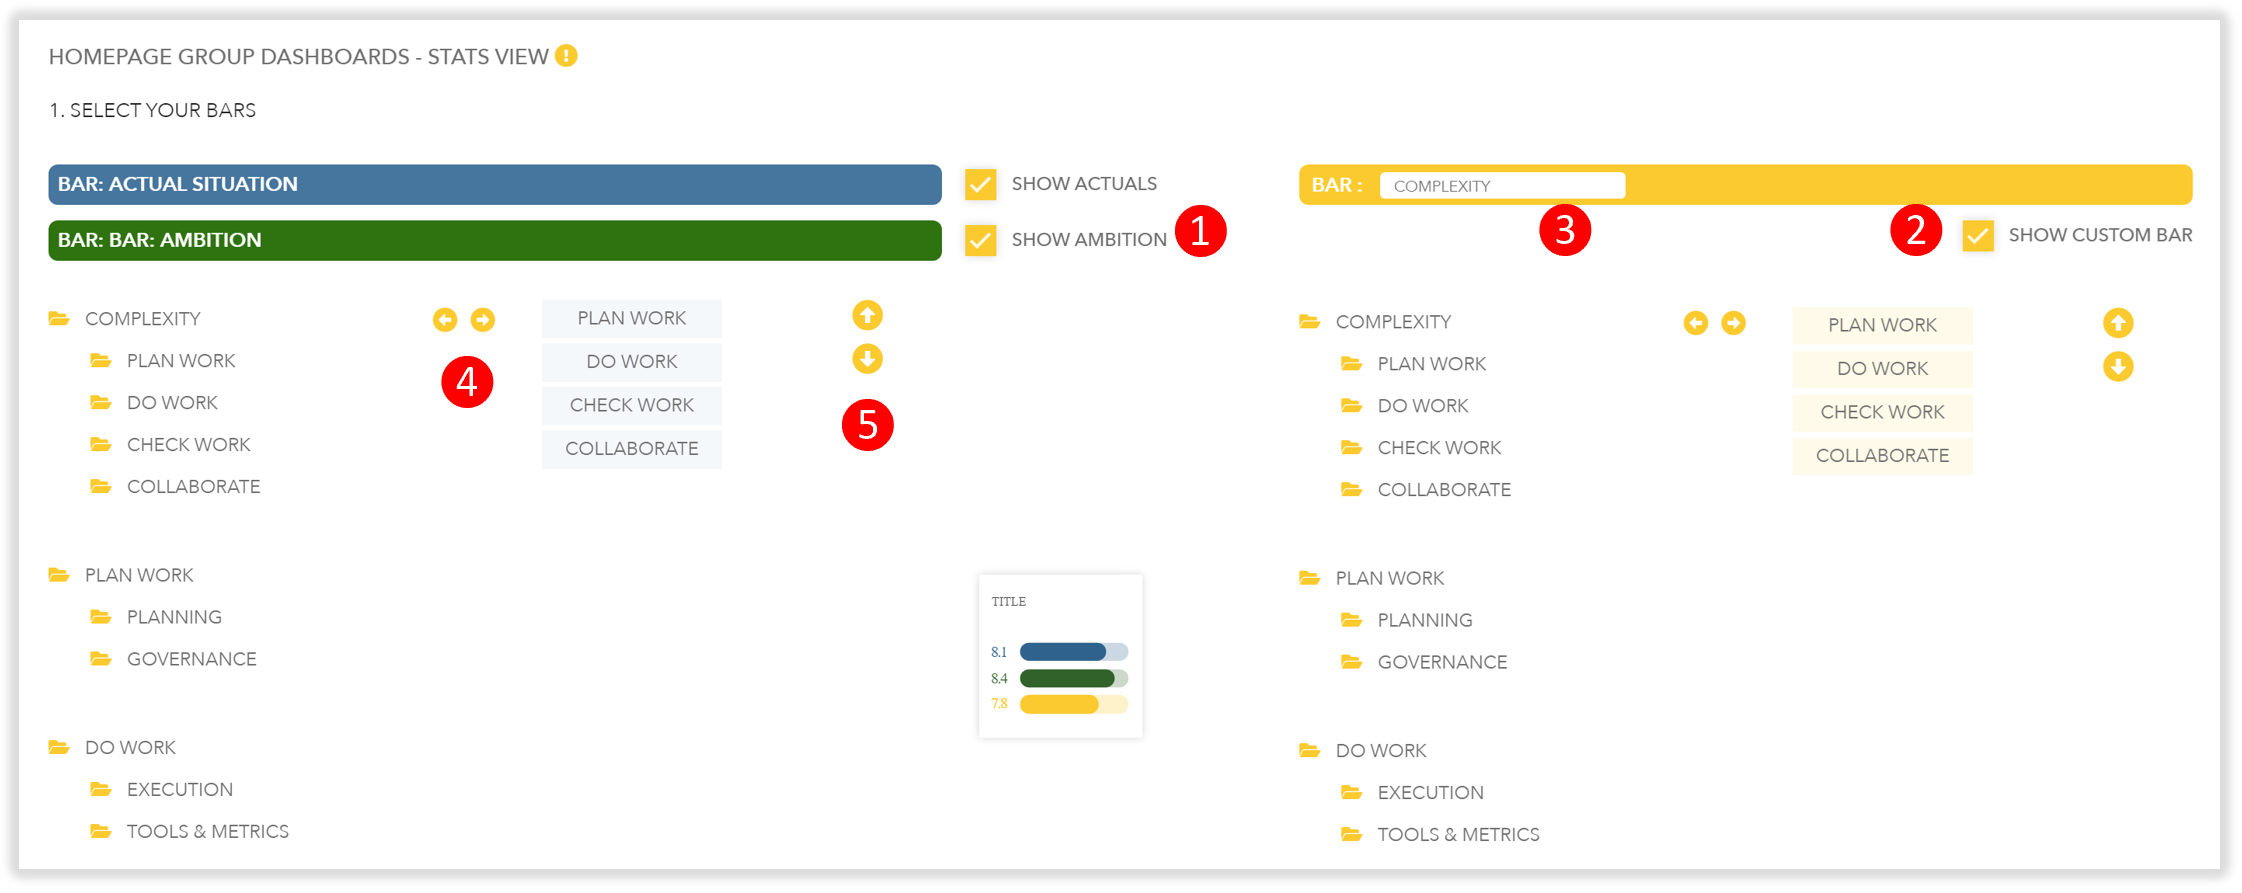
Here are the main functions (the red numbers):
- Select whether to show Actual- and/or Ambition score
- Idem for the 3rd score
- Text box to give that 3rd score a name
- Select a Topic or Sub-Topic in the Questionnaire structure and click on the yellow right-arrow button to select. You can select up to 8 items. Click a selected Topic/Sub-Topic and click on the yellow left-arrow button to unselect.
- You can change the sequence of the selected items with the up/down arrows.
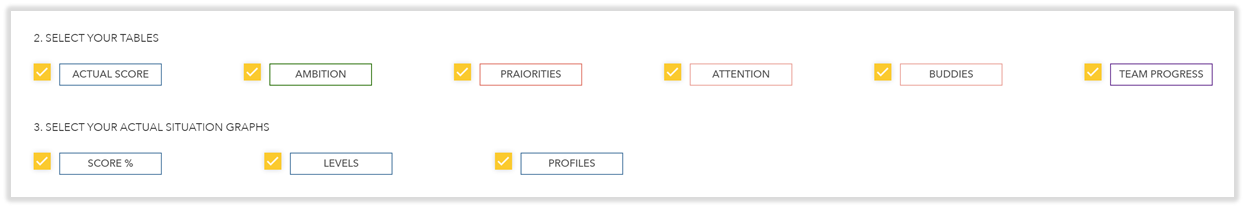
The summary tables can be selected with a simple checkbox. The same holds for the "division of scores"-bar-chart and the pie-charts for the maturity levels and the profiles: